ASRock DeskMini 110 mini-STX PC Review
by Ganesh T S on June 8, 2016 8:45 AM ESTPerformance Metrics - I
The ASRock DeskMini 110 was evaluated using our standard test suite for small form-factor PCs. Not all benchmarks were processed on all the machines due to updates in our testing procedures. Therefore, the list of PCs in each graph might not be the same. In the first section, we will be looking at SYSmark 2014, as well as some of the Futuremark benchmarks.
BAPCo SYSmark 2014
BAPCo's SYSmark 2014 is an application-based benchmark that uses real-world applications to replay usage patterns of business users in the areas of office productivity, media creation and data/financial analysis. Scores are meant to be compared against a reference desktop (HP ProDesk 600 G1 with a Core i3-4130, 4GB RAM and a 500GB hard drive) that scores 1000 in each of the scenarios. A score of, say, 2000, would imply that the system under test is twice as fast as the reference system.
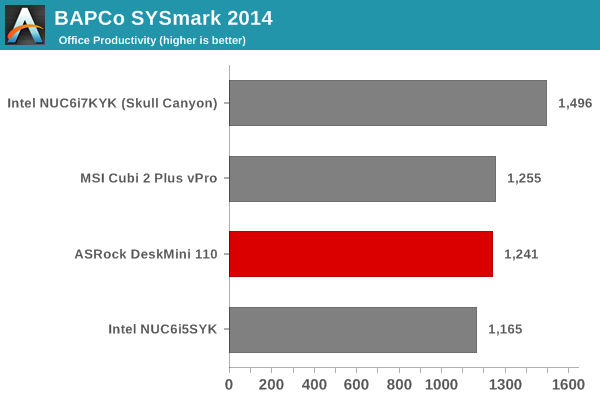
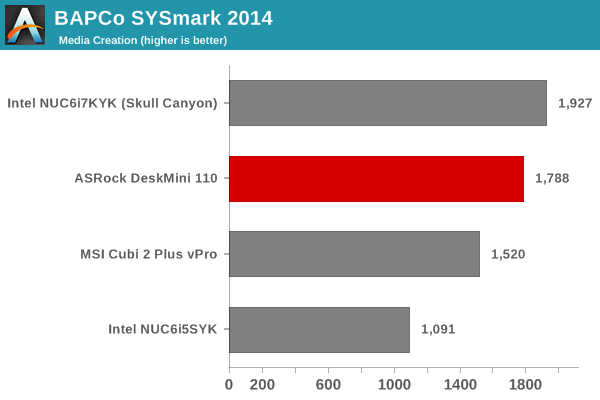
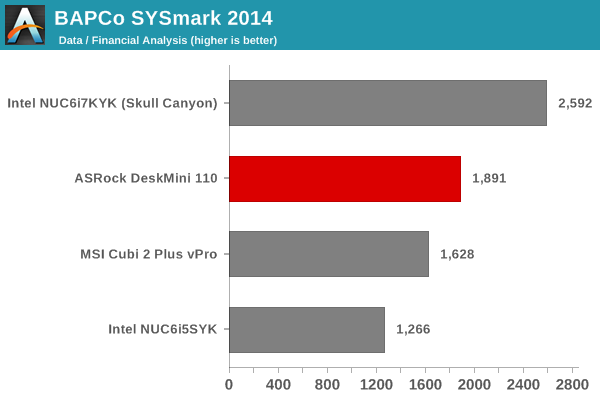
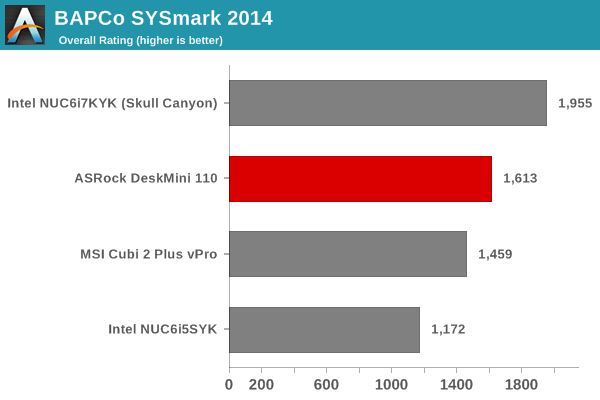
SYSmark scores are heavily dependent on the CPU in the system. Here, we see the 65W TDP Core i5-6500 come behind the 45W TDP Core i7-6770HQ, primarily due to the hyperthreading (4C/8T) features of the latter. Note that the Core i5-6500 is a 4C/4T CPU. Other than that, the DeskMini that we built has no trouble proving to be better at business workloads compared to systems equipped with lower TDP CPUs.
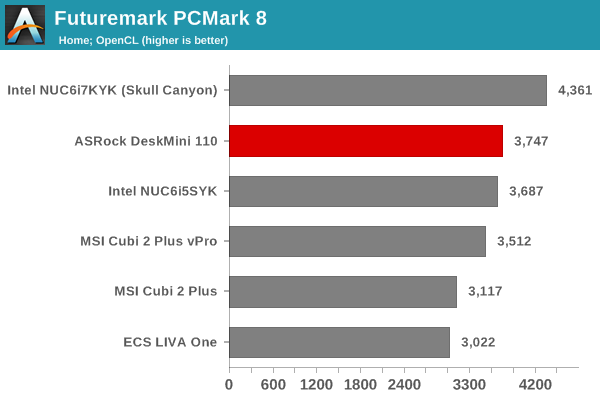
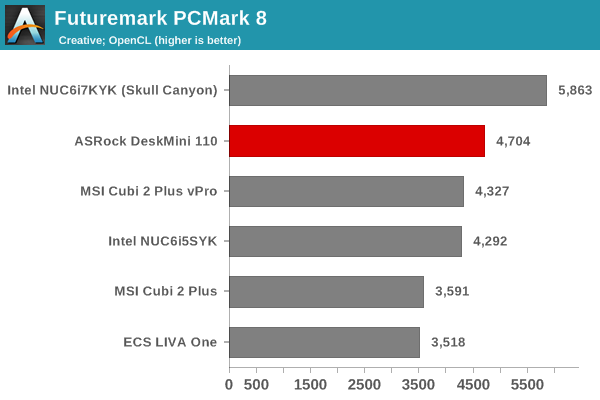
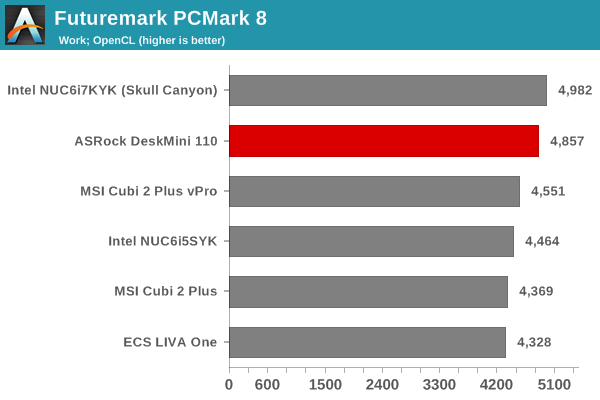
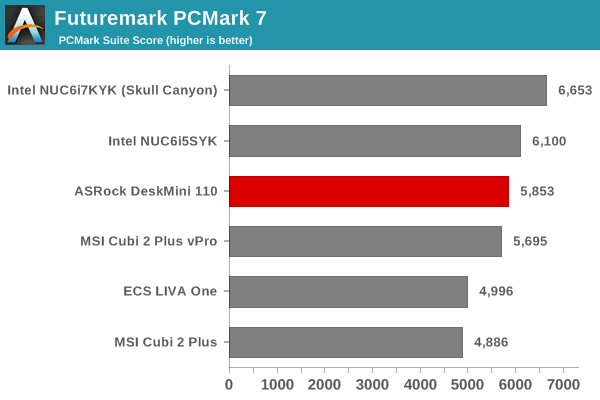
Futuremark PCMark 8
PCMark 8 provides various usage scenarios (home, creative and work) and offers ways to benchmark both baseline (CPU-only) as well as OpenCL accelerated (CPU + GPU) performance. We benchmarked select PCs for the OpenCL accelerated performance in all three usage scenarios. These scores are heavily influenced by the CPU in the system. The aspects noted in the SYSmark 2014 subsection apply here too. The DeskMini comes second to Skull Canyon, but has no trouble being better than the other systems in the comparison list.
Miscellaneous Futuremark Benchmarks
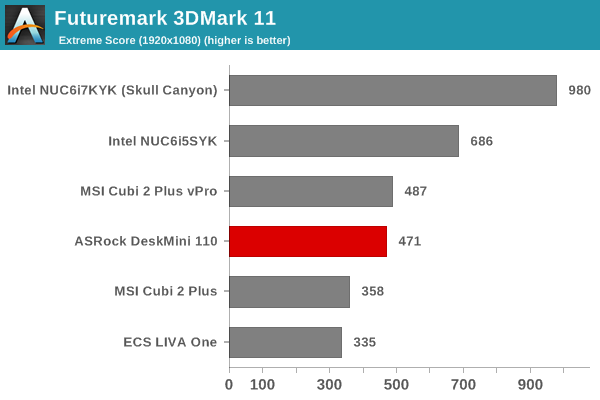
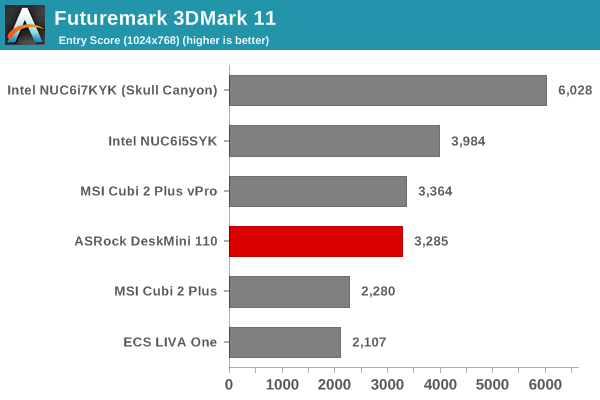
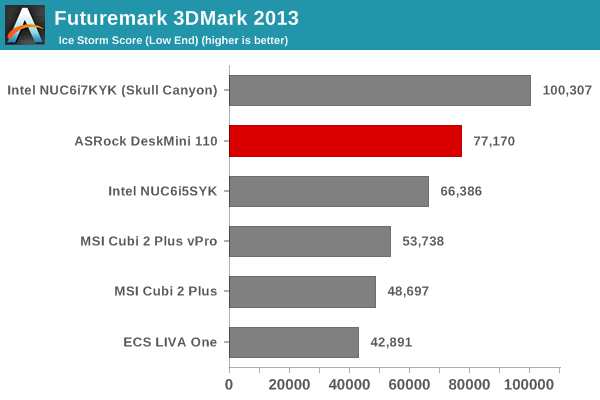
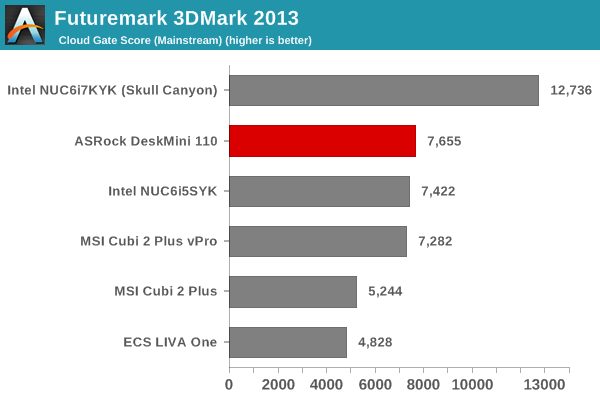
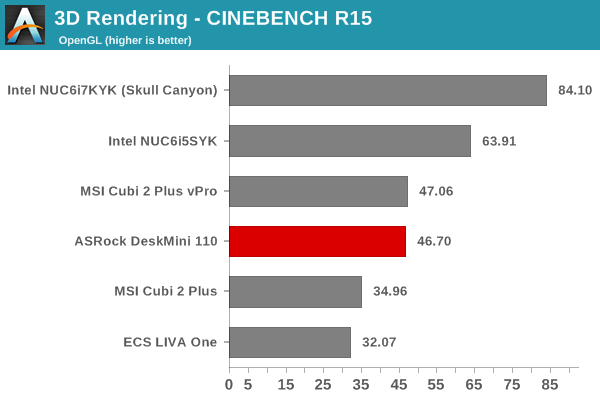
The 3D benchmarks present a different story, because the HD Graphics 530 is not as powerful as the GPUs in either Skull Canyon (Iris Pro with eDRAM) or even the U-series models for many workloads.
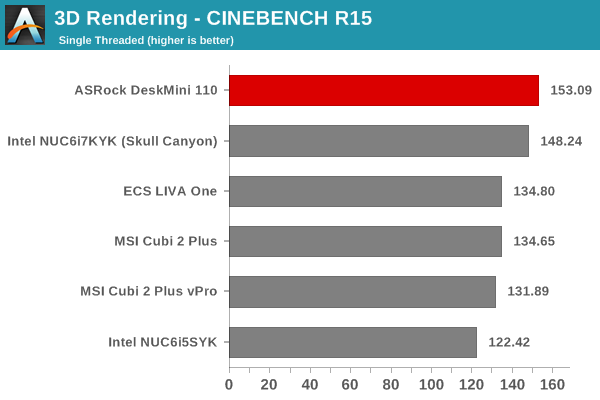
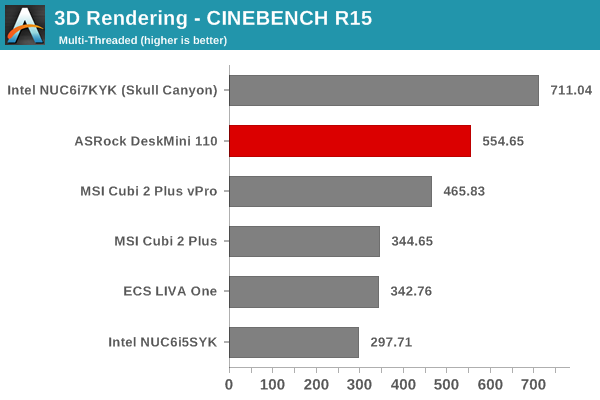
3D Rendering - CINEBENCH R15
We have moved on from R11.5 to R15 for 3D rendering evaluation. CINEBENCH R15 provides three benchmark modes - OpenGL, single threaded and multi-threaded. Evaluation of select PCs in all three modes provided us the following results. The Core i5-6500's single threaded performance is top of the line, thanks to the high TDP / clock speed. However, absence of hyperthreading allows Skull Canyon (Core i7-6770HQ) to sneak ahead in the multi-threaded case. The OpenGL results lend further credence to the analysis of the GPU capabilities made in the previous subsection.


85 Comments
View All Comments
extide - Monday, June 13, 2016 - link
Then it would be ini-ITX .. which has been around forever..extide - Monday, June 13, 2016 - link
Mini ITX *extide - Thursday, June 9, 2016 - link
Come on guys , full page ad completely covering the page. It was the LG OLED TV ad. PLEASE get rid of that BSLolimaster - Saturday, June 11, 2016 - link
Ublock is your friendextide - Monday, June 13, 2016 - link
I know how to use adblock, but I prefer to leave ads turned on here if possible, and so should you.stubblepoo - Friday, June 10, 2016 - link
hmm, slowly inching towards my dream of stuffing something into an orange Gamecube case and being able to run dolphin off it...jaydee - Friday, June 10, 2016 - link
There is conflicting information on the front page, whether the USB type-C is 3.0 or 3.1 specganeshts - Friday, June 10, 2016 - link
3.1 Gen 1 = 3.0No conflict, it will operate at 5 Gbps max. theoretical rate.
jaydee - Friday, June 10, 2016 - link
So basically it's going to be like when graphics cards and monitors said they were "HDMI v1.4", when in fact they were pretty much HDMI v1.2, because they didn't support resolutions higher than 1920x1200. Perfect.extide - Monday, June 13, 2016 - link
No...